File:Milankovitch Variations.png
此為最大尺寸。
Milankovitch_Variations.png (479 × 363 像素,檔案大小:32 KB,MIME 類型:image/png)
摘要
| 描述 |
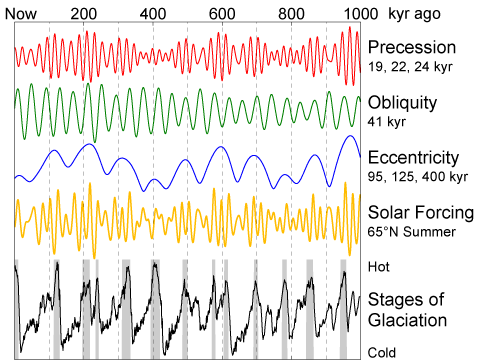
English: This figure shows the variations in Earth's orbit, the resulting changes in solar energy flux at high latitude, and the observed glacial cycles.
According to Milankovitch Theory, the precession of the equinoxes and the apsides, variations in the tilt of the Earth's axis (obliquity) and changes in the eccentricity of the Earth's orbit are responsible for causing the observed 100 kyr cycle in ice ages by varying the amount of sunlight received by the Earth at different times and locations, particularly high northern latitude summer. These changes in the Earth's orbit are the predictable consequence of interactions between the Earth, its moon, and the other planets. The orbital data shown are from Quinn et al. (1991). Principal frequencies for each of the three kinds of variations are labeled. The solar forcing curve (aka "insolation") is derived from July 1st sunlight at 65 °N latitude according to Jonathan Levine's insolation calculator [1]. The glacial data are from Lisiecki and Raymo (2005) and gray bars indicate interglacial periods, defined here as deviations in the 5 kyr average of at least 0.8 standard deviations above the mean. |
| 日期 | 2006年2月11日 (上傳日期) |
| 來源 | 自己的作品 |
| 作者 | This image was produced by Robert A. Rohde from publicly available data, and is incorporated into the Global Warming Art project. |
| 其他版本 | 此檔案衍生的作品: Variacions de Milankovitch.png |
References
- Lisiecki, L. E., and M. E. Raymo (2005), "A Pliocene-Pleistocene stack of 57 globally distributed benthic δ18O records." Paleoceanography 20, PA1003, doi:10.1029/2004PA001071 (alternative full text link: [2]).
- Quinn, T. R., S. Tremaine, and M. Duncan (1991), "A Three Million Year Integration of the Earth's Orbit." The Astronomical Journal 101, pp. 2287-2305, doi:10.1086/115850.

|
本圖片是以PNG、GIF或JPEG格式上傳。然而,其中包含的資料或訊息,應該重新建立成可縮放向量圖形(SVG)檔案,以更有效率或更準確的方式儲存。如有可能,請上傳本圖片的SVG格式版本。在上傳之後,請修改維基各姊妹計畫中所有使用舊版圖片的條目(列在圖像連結章節中),替換為新版圖片,並在舊圖片的描述頁中加入{{Vector version available|新圖片名稱.svg}}模板,同時移除本模板。
|
授權條款
Image from Global Warming Art
This image is an original work created for Global Warming Art. Please refer to the image description page for more information.

|
已授權您依據自由軟體基金會發行的無固定段落、封面文字和封底文字GNU自由文件授權條款1.2版或任意後續版本,對本檔進行複製、傳播和/或修改。該協議的副本列在GNU自由文件授權條款中。 |
| 此檔案採用創用CC 姓名標示-相同方式分享 3.0 未在地化版本授權條款。 | ||
| ||
| 已新增授權條款標題至此檔案,作為GFDL授權更新的一部份。 |
檔案歷史
點選日期/時間以檢視該時間的檔案版本。
| 日期/時間 | 縮圖 | 尺寸 | 使用者 | 備註 | |
|---|---|---|---|---|---|
| 目前 | 2006年2月11日 (六) 11:35 | | 479 × 363(32 KB) | David Legrand | == Description == This figure shows the variations in Earth's orbit, the resulting changes in solar energy flux at high latitude, and the observed glacial cycles. According to Milankovitch Theory, the precession of the [[ |
檔案用途
下列4個頁面有用到此檔案:
全域檔案使用狀況
以下其他 wiki 使用了這個檔案:
- af.wikipedia.org 的使用狀況
- ar.wikipedia.org 的使用狀況
- be.wikipedia.org 的使用狀況
- bg.wikipedia.org 的使用狀況
- ca.wikipedia.org 的使用狀況
- da.wikipedia.org 的使用狀況
- de.wikipedia.org 的使用狀況
- de.wikiversity.org 的使用狀況
- el.wikipedia.org 的使用狀況
- en.wikipedia.org 的使用狀況
- es.wikipedia.org 的使用狀況
- fa.wikipedia.org 的使用狀況
- fi.wikipedia.org 的使用狀況
- fr.wikipedia.org 的使用狀況
- fy.wikipedia.org 的使用狀況
- gl.wikipedia.org 的使用狀況
- hu.wikipedia.org 的使用狀況
- hy.wikipedia.org 的使用狀況
- id.wikipedia.org 的使用狀況
- ja.wikipedia.org 的使用狀況
- ko.wikipedia.org 的使用狀況
- nl.wikipedia.org 的使用狀況
檢視此檔案的更多全域使用狀況。